Package Structure
structure.RmdStructure
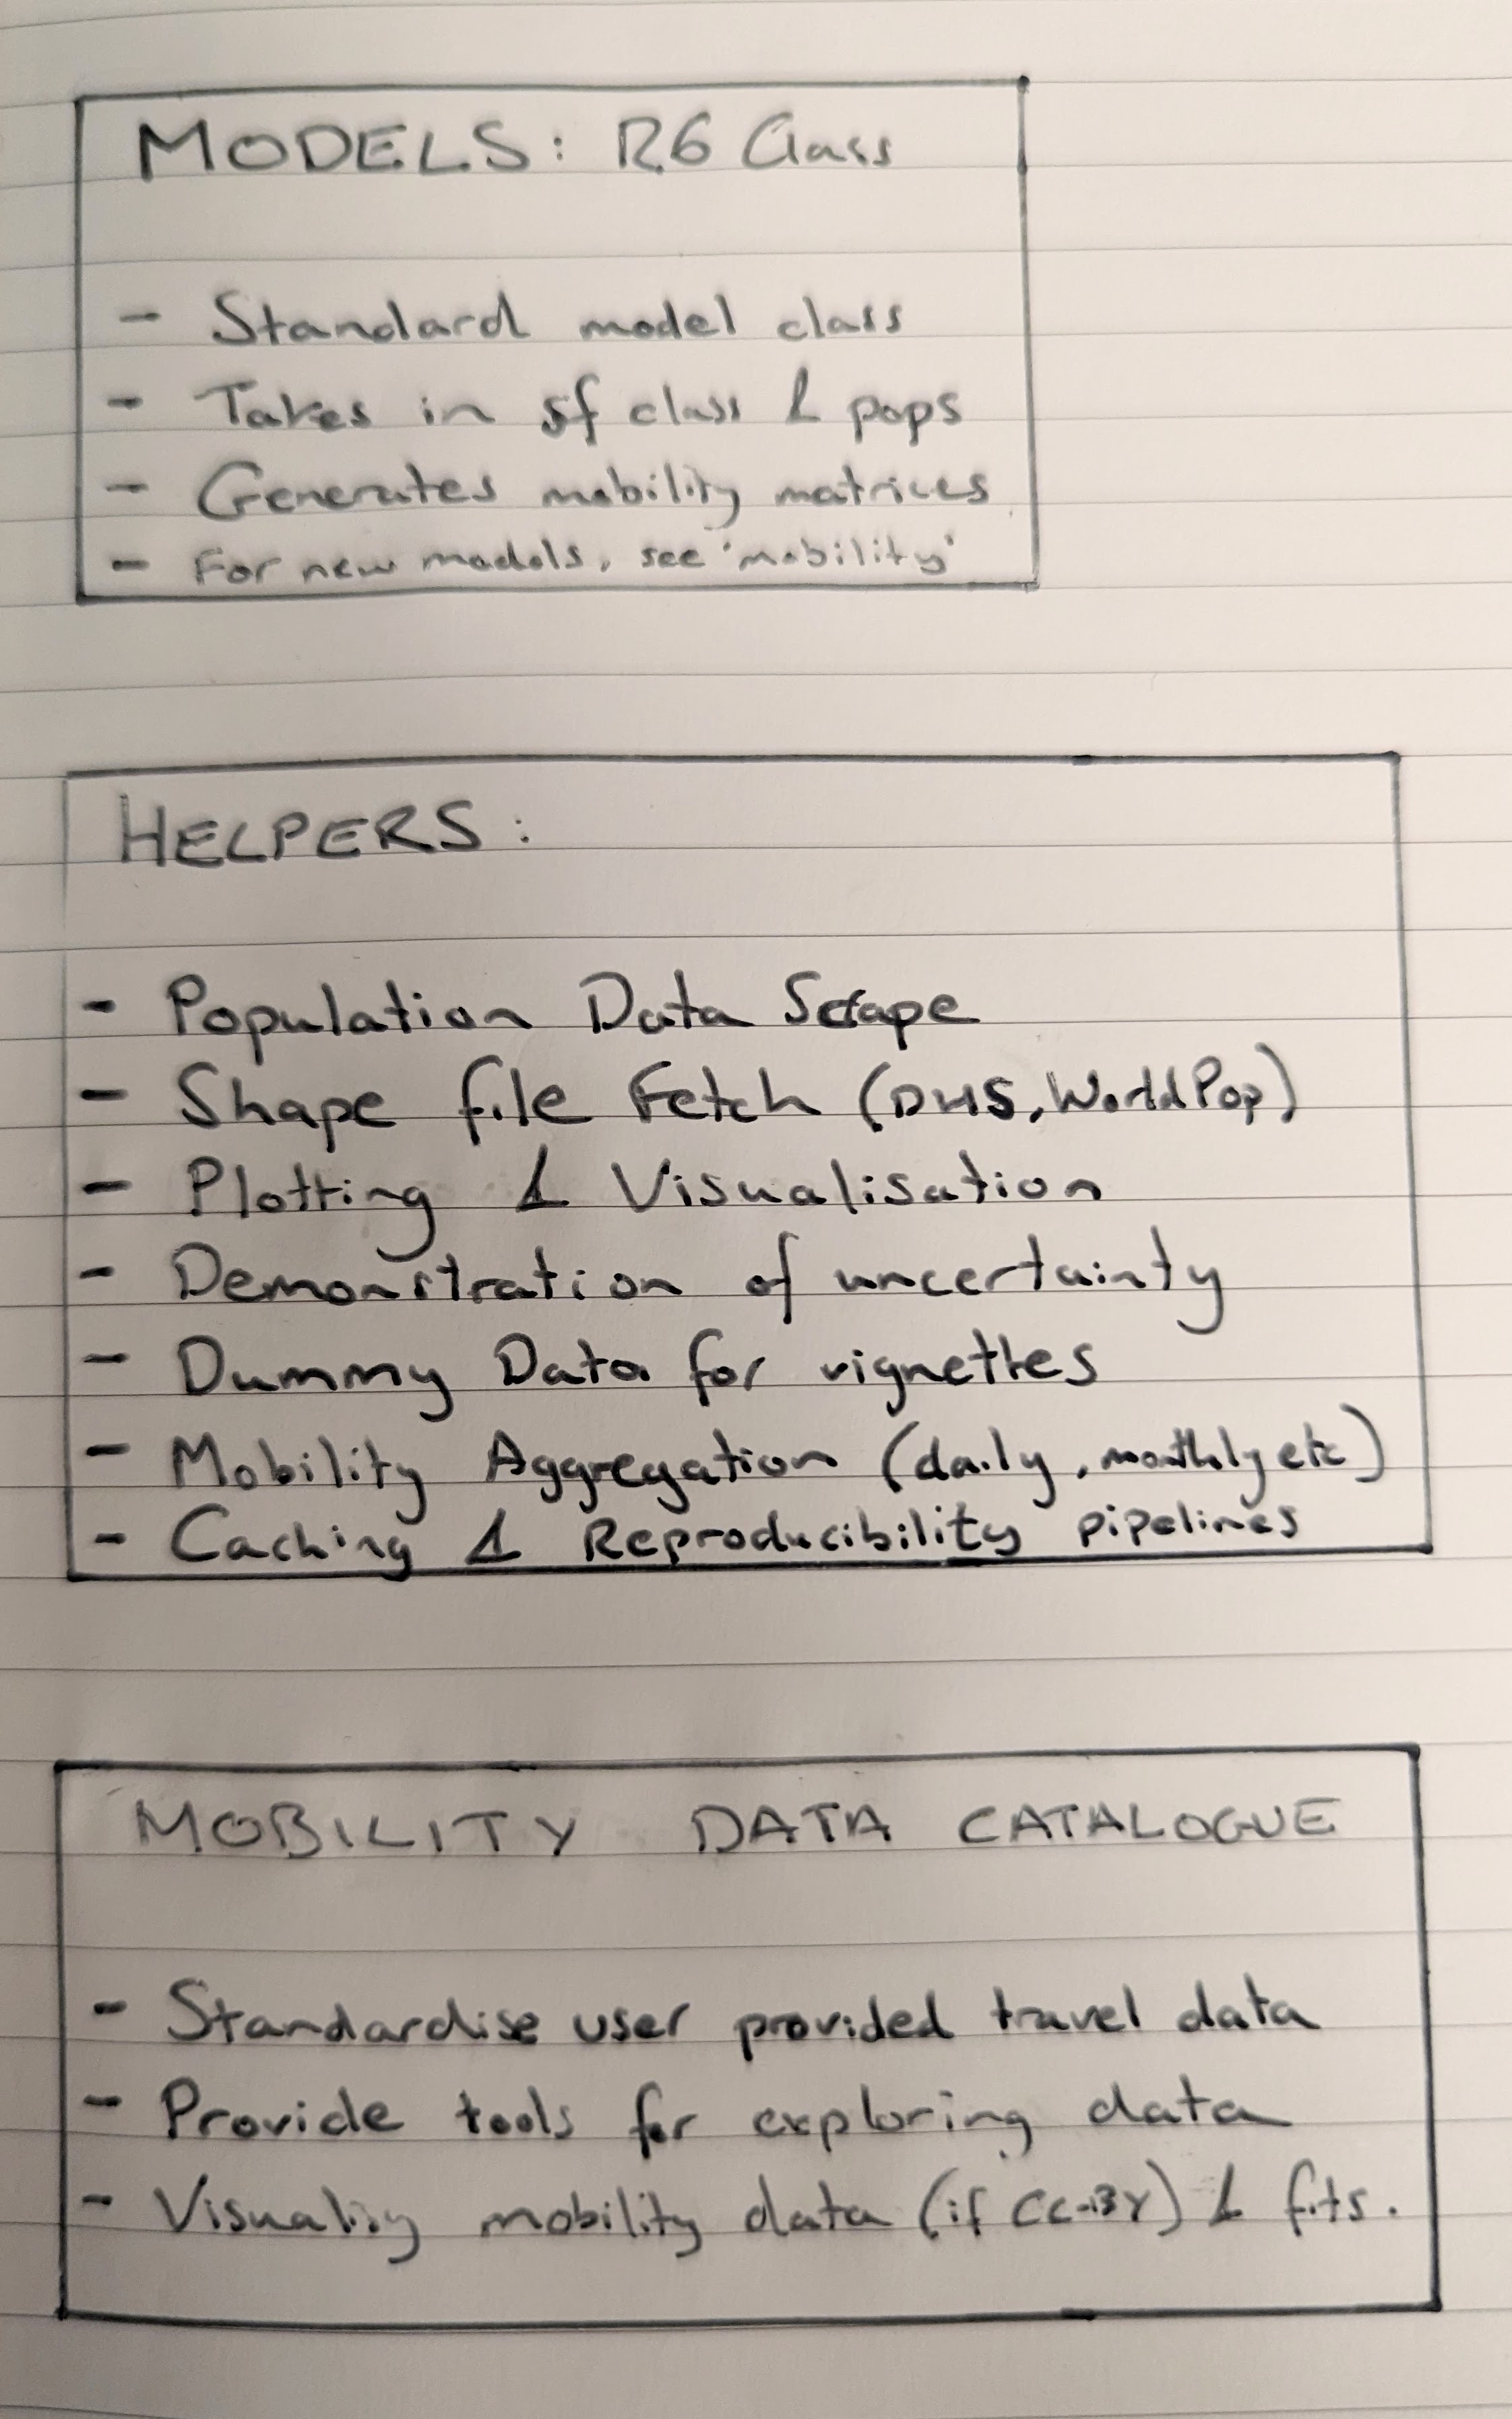
This is an overall structure of the nomad package, which
details the different components (models, underlying data, population
helpers etc).
The package components are shown below:
 The current
features are detailed below with respect to specific development
milestones:
The current
features are detailed below with respect to specific development
milestones:
Milestone 1
1. Models
The main workhorse is an R6 mobility model class. This
class will store mobility models, which will include the same
functionality of the mobility model (prediction to new
data, use for destination probability prediction etc), while providing
additional functionality to help users:
- Show the model performance against the data used in fitting
- Descriptions of the model type
- Description of the data set used in fitting (links to data catalogue)
- Reproducibility caching for stochastic draws
Models are stored in nomad for users to apply for their
own research need. To help users identify the best model for their
needs, nomad also maintains a data catalogue of the
different mobility data sets that have been used in producing the
mobility models available in nomad.
2. Data Catalogue
The data catalgoue will be a structure data set (format undecided as yet) for storing meta data about each mobility data set that has been used to create mobility models. The meta data (mobility data survey size, sampling scheme, respondent characteristics, location, associated publication, date of survey, description of data censoring or aggregation, spatial resolution etc) will help guide users to understand which data source seems most suitable for their use case.
For example, end users may want to choose mobility models that have
been fit using data from the same country as their analysis, or may want
to select based on mobility data type (flight data, travel surveys etc).
To facilitate this need, nomad provides functionality to
query and visualise mobility data:
- Maps of data locations
- Visualisations of survey sizes
- Querying spatial scale of surveys, e.g. admin level
Once users have identified suitable data sets, they can identify the associated model objects for fits to these data sets.
3. Helper Functions
End users are likely to approach nomad with their own
location data (lat/long, shape files, distance matrices etc) and
possibly linked population data. To help users get their data into a
format needed for mobility models as well as to help
provide interpretation and reproducibility for their analyses, we
provide series of helper functions in nomad:
- API tools for population data sets (WorldPop)
- Conversion from population rasters to shape files
- Plotting and visualisation of outputs from mobility models
Lastly, provide suppoting vignettes and guides to give demonstration
of full functionality, relationship to the mobility package
as well as how users with their own mobility data can use
mobility to fit mobility models and how to integrate these
with nomad either by submitting new PRs, or by converting
their mobility model into one that can leverage nomad
functionality.
Milestone 2
- Inclusion of additional models for each data set and way for users to query the model fit summary statistics to identify alternative models for the same data.
- Warnings when users provide lat/long or shapes that cross international borders as there are no data sets currently that are suitable for modelling international mobility.
- Warning when users provide lat/long or shapes that are below the spatial resolution of the data set used to fit the model, e.g. lat/long is for villages inside an admin 2, but the data only had one data point per admin 2 unit.
Milestone 3
- Uncertainty visualisation. From 100 stochastic draws, generate range of metrics to describe each matrix and visualise the upper/lower matrices based on the different metrics.
Milestone 4
- Tool for creating simple ensemble mobility models (predicting from multiple models with appropriate weights based on user needs)
- Interactive tool for demonstrating the difference between model predictions and linking this to an ensemble (widget slider for different weights)
- Vignette to demonstrate how to select a model to use. Possible ideas include simulating dummy infectious disease spatial model and then identifying the best model best on goodness of fit based on different mobility models, while fixing everything else.