Models and Mobility Data
model.RmdThis vignette provides a description of the performance of each model
in nomad and the mobility data that underpins those models.
This vignette provides all the information required to help you identify
the most suitable model for your needs.
Mobility Data
The following table provides the description and overall summaries of
the different mobility data sets that have been used to create the
mobility models stored in nomad. Users may wish to search
for the data that they believe would be most representative for their
use cases, e.g. collected from the same country, or collected at the
same spatial scale.
Sample scheme details, censoring as well as the timing of the sample can all be viewed below.
To help identify which mobility data may be most suitable for your use case, we have provided the following interactive map to show you the locations of all available mobility data:
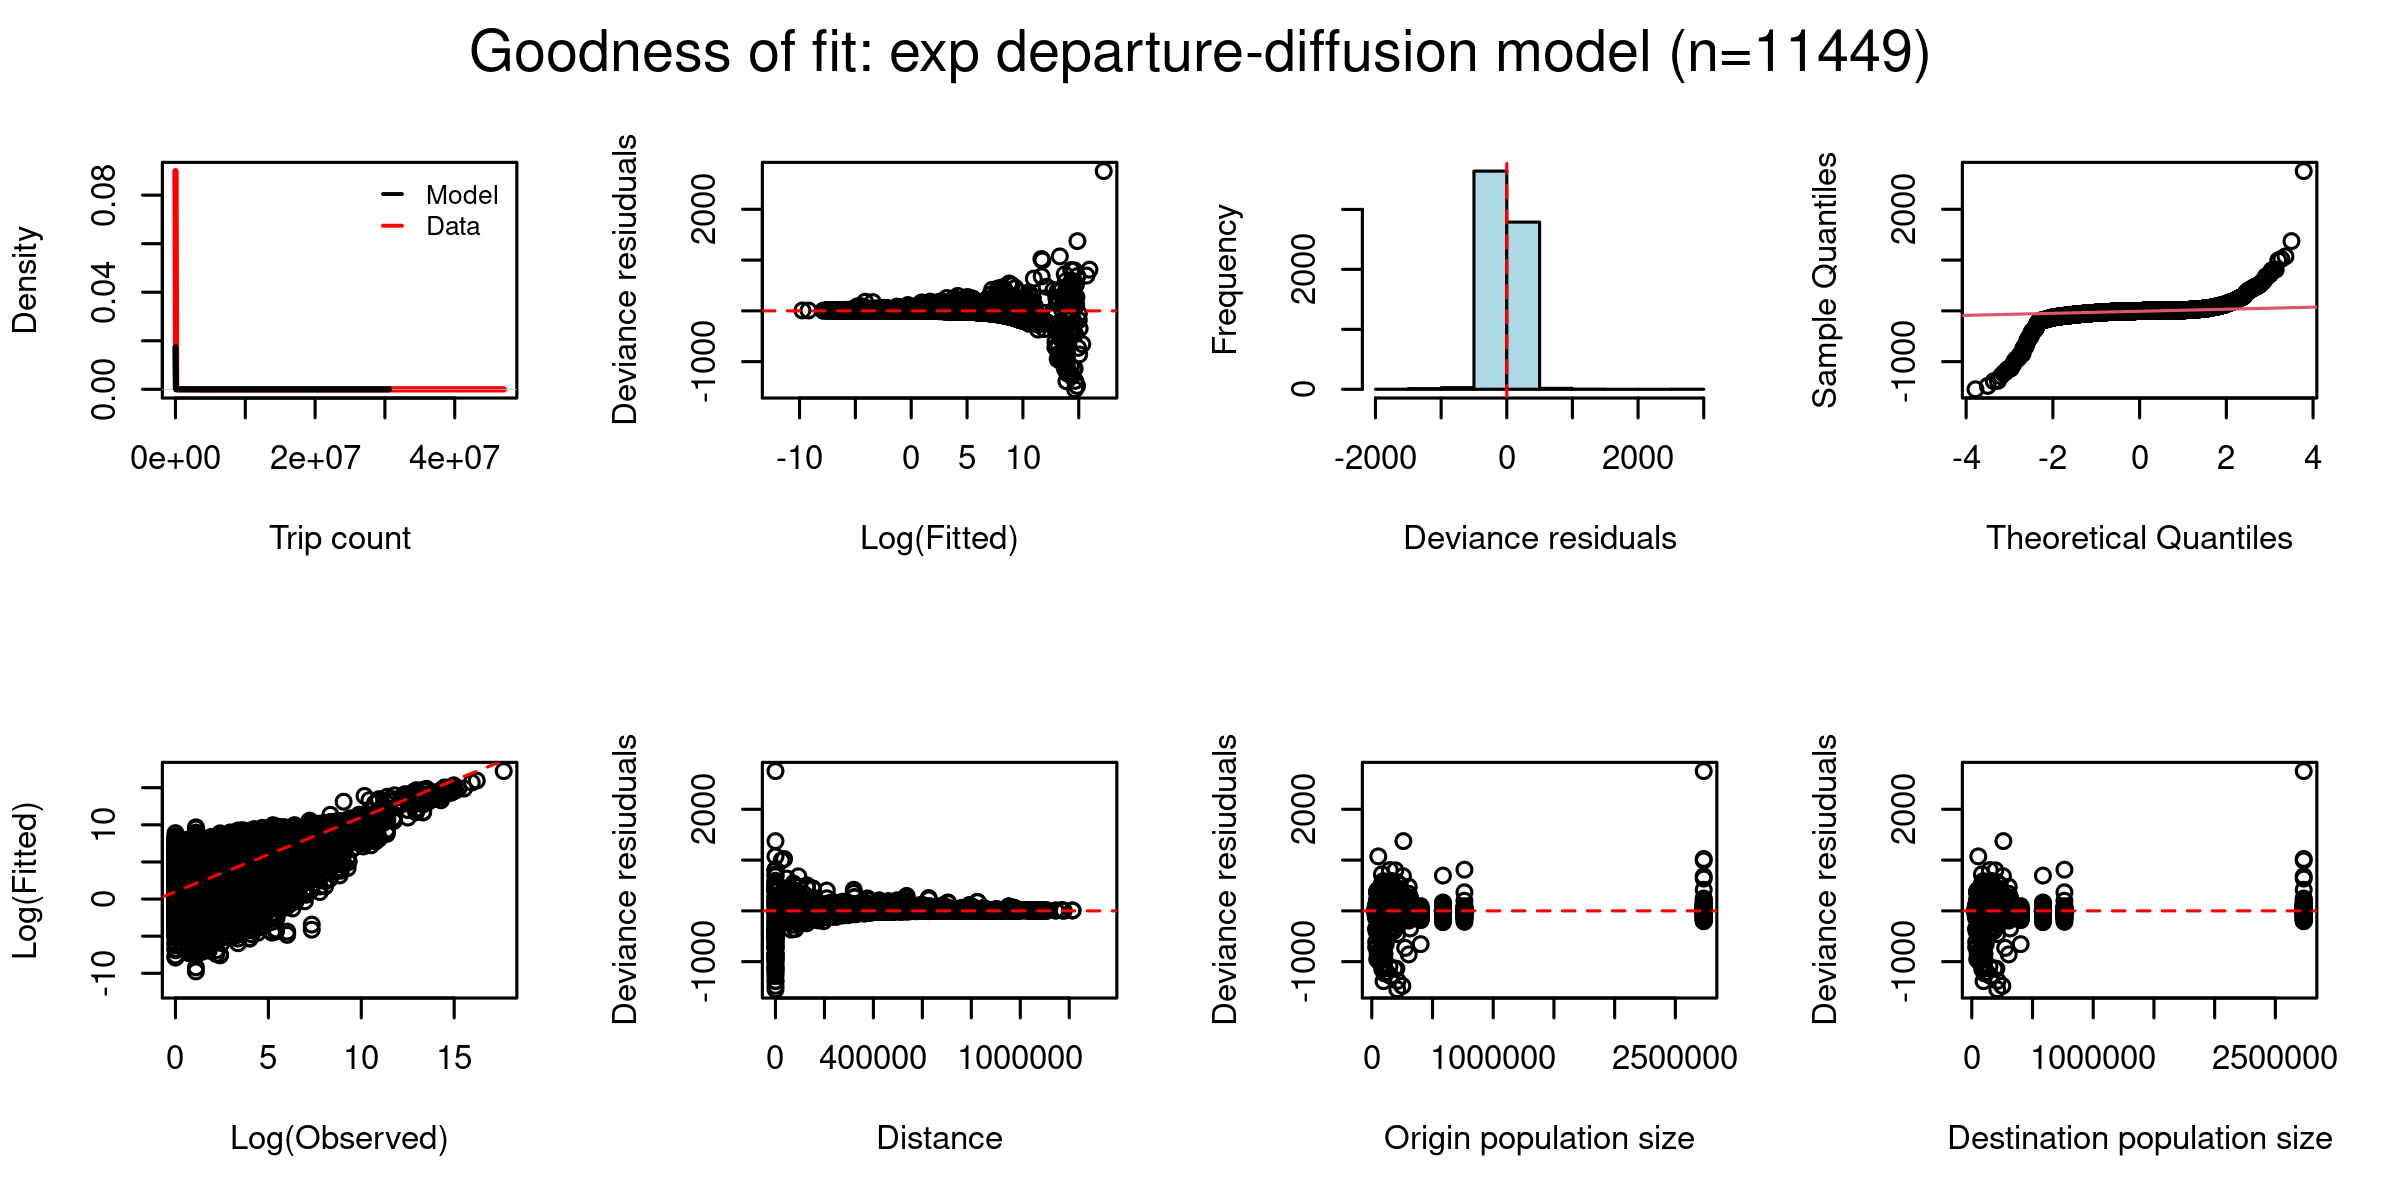
Model Performance
The following table provides the description and overall evaluation
statistics of each model that is stored in nomad.
You can search across all the models, e.g. by searching for models that used the mobility data that you have identified as most suitable for your setting, or by sorting the model table with respect to desired model characteristics, e.g. lowest DIC. By default the table is sorted by the \(R^2\) of the model fit.
Alternatively, you could select for specific mobility models
(gravity, radiation, and
departure-diffusion) or their sub types (see
?mobility::mobility) for more information on sub-types.