Plot coverage gaps in data
plot_coverage.RdPlot coverage gaps in data
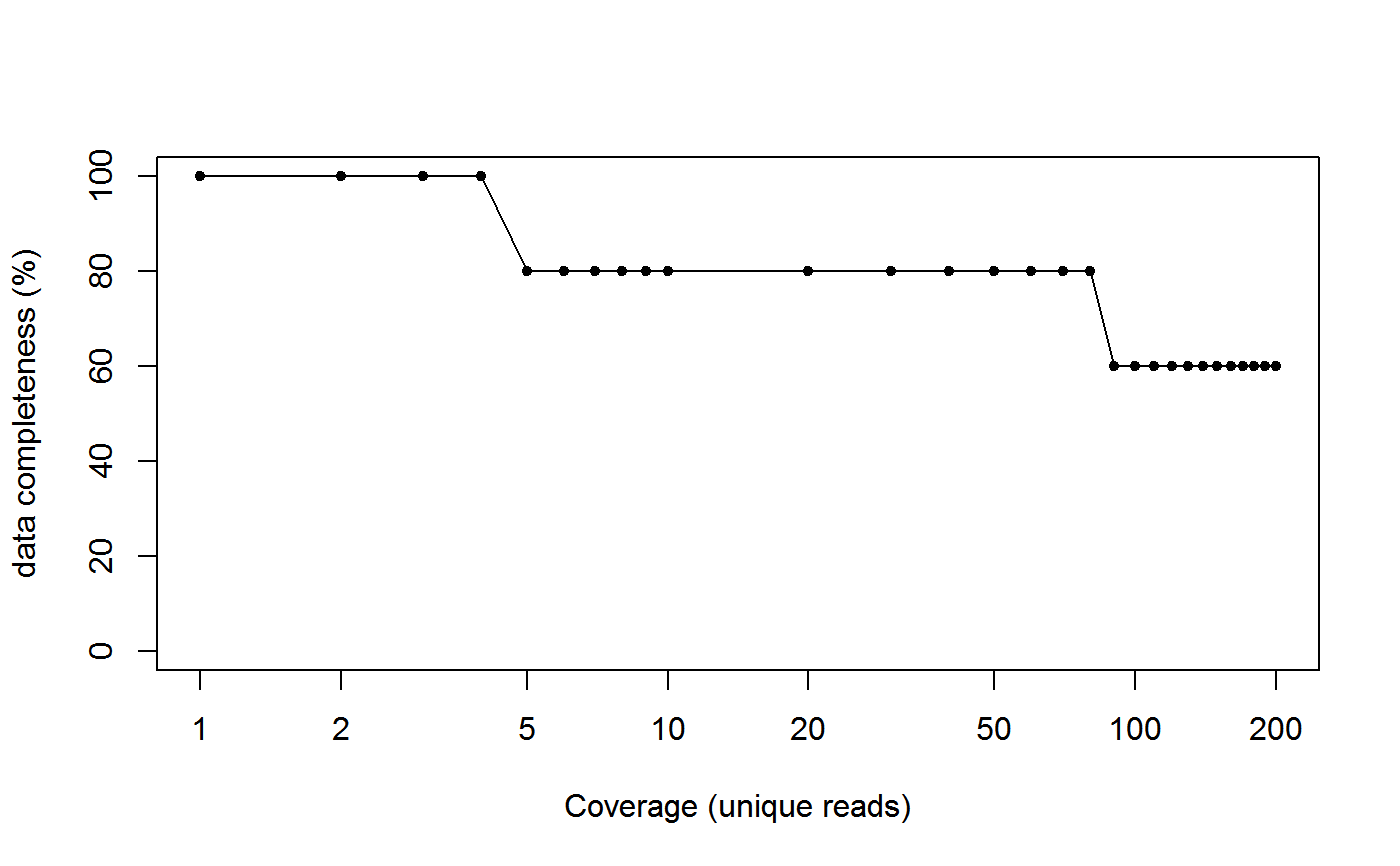
plot_coverage(dat, type = "o", pch = 20, ylim = c(0, 100),
  xlab = "Coverage (unique reads)", ylab = "data completeness (%)",
  log = "x", ...)
Arguments
| dat | MIP data. The data must have the following variables:
|
|---|---|
| type | 1-character string giving the type of plot desired. The
following values are possible, for details, see |
| pch | Either an integer or a single character specifying a symbol to be
used as the default in plotting points. See |
| ylim | the y limits of the plot. |
| xlab | a label for the x axis, defaults to a description of |
| ylab | a label for the y axis, defaults to a description of |
| log | a character string which contains |
| ... | other arguments to |
Details
Plot a line graph showing the percentage of sites that have more than a given number of unique reads (coverage).